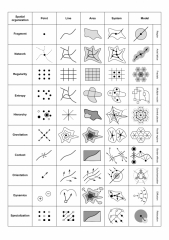
Chorems are basic dually conceived components of graphical models, they are taken both as constructional components and graphical visualised formulations of a spatial structure.
Matrix of chorems (types of structure/interactions of spatial organisation in rows and types of characteristics in columns) schematically presents in 50 cells model situations of spatial distribution of components. Each row includes a particular model that has been applied during the historical development of human and regional geography. Matrix of chorems was published in Halás, Klapka (2009) and Klapka, Frantál, Halás, Kunc (2010) and follows and extends a simpler matrix of chorems (Brunet 1986 – 28 model situations) or a refined matrix of chorems (Ducruet 2006) that includes the review of possibilities of generalisations in graphical modelling.
Sources:
Brunet, R. (1986): La carte-modèle et les chorèmes. Mappemonde 86 (4), 4 – 6.
Ducruet, C. (2006): Benchmarking urban networking Strategies in Europe: An application of chorems to France and Great Britain. The Korea Spatial Planning Review 49 (6), 3 – 24.
Halás, M., Klapka, P. (2009): Grafické modely regiónov [Graphical models of regions]. Acta Geographica Universitatis Comenianae 53, 49 – 57.
Klapka, P., Frantál, B., Halás, M., Kunc, J. (2010): Spatial organisation: development, structure and approximation of geographical systems. Moravian Geographical Reports 18 (3), 53 – 65.
