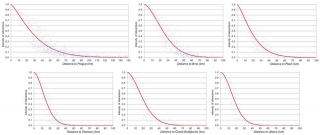
Distance decay function
It expresses changes (decrease or decay) in interactions between a centre based on the distance from this centre. These interactions can have various character, most common being transport, migration or travel-to-work flows. Taylor (1971) detailed and distinguished basic types of distance decay functions: normal, exponential, square-root exponential, lognormal and Pareto functions. During time more complex functions with more (2 – 4) parameters have been used in spatial interaction modelling, e.g. power-exponential, Tanner´s, March´s, Weibull´s squared Cauchy, Box-Cox or Richards´ functions. For modelling of nodal (core-oriented) flows of population bell-shaped functions with an inflection point changing its curve from concave to convex (see Halás et al. 2014 for more details and fig. 1 below).
Radius of influence
expresses statistically for distance decay function a theoretical distance of 100% influence of a regional centre. Resulting value determines radius of influence and extent of influence of a centre, but the population size of an area cannot be derived from it. In case the value of maximal interaction intensity is equal to 1 (for a distance from a centre d = 0), it is possible to express the value for radius of influence graphically (fig. 2). The radius of influence was introduced by Halás et al. (2014).
Source
Halás, M., Klapka, P., Kladivo P. (2014): Distance-decay functions for daily travel-to-work flows. Journal of Transport Geography 35, 107–119.
Further reading
Taylor, P. J. (1971).:Distance transformation and distance decay function. Geographical Analysis 3 (3), 221–238.


